Interactive Network Builder
Create professional network diagrams with drag-and-drop interface
Editing Tools
Add Node
Network Visualization
Key Features of Network Diagram
Powerful tools and features designed to help you create professional network diagrams with ease
Data-driven Insights
Create network diagrams to help enterprises and teams analyze relationships between data points and make informed decisions faster.
Easy to Use
Intuitive interface that allows users without design experience to quickly create professional visual content.
Drag & Drop Interface
User-friendly interface with drag-and-drop functionality to structure diagrams exactly as you envision.
Export & Share
Export diagrams as high-quality SVGs, PDFs, or images, and share directly via link for seamless integration.
Interactive Elements
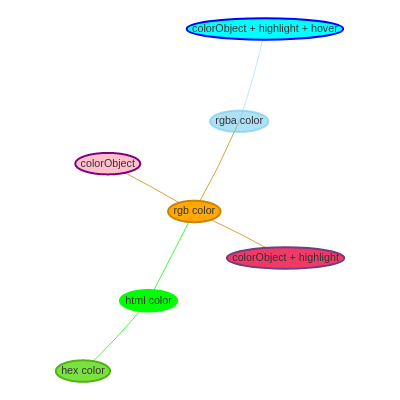
Add clickable nodes, tooltips, and hover effects to create interactive diagrams with rich insights.
Multi-Device Support
Access and edit your diagrams from any device—desktop, tablet, or mobile—for ultimate flexibility.
How to Use Network Diagram
Creating professional network diagrams is easy with our intuitive step-by-step interface
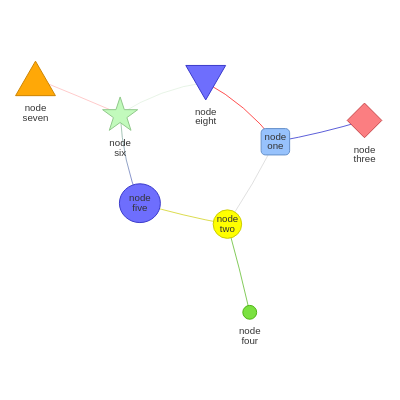
- Add Nodes: Click the "Add Node" button and enter a label for your node. Customize the node's appearance by selecting a shape and icon from the Node Styles panel.
- Add Edges: Select a node to display a menu, then choose the node you want to connect to from the menu. Customize the edge's style, such as line type and arrow, from the Edge Styles panel.
- Arrange Layout: Drag and drop nodes to manually rearrange them into your desired layout.
- Save and Share: Click the "Save" button to store your network diagram. You will be prompted to enter a title and edit password. After saving, a link will be generated that you can share with others. The link can also be used to re-edit the diagram later.
- Export as Image or SVG: To download your network diagram as an image or SVG file, click the "Export" button in the top menu. Select your desired file format (PNG or SVG) and click "Download". The file will be saved to your device, ready for use in presentations, reports, or other documents.
With these simple steps, you'll be able to create professional-looking network diagrams, workflows, and relationship visualizations in no time!
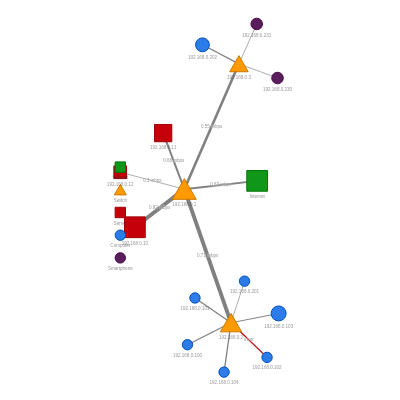
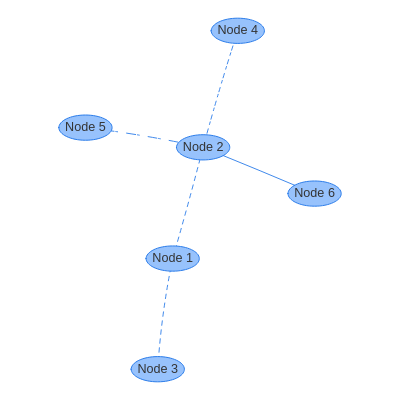
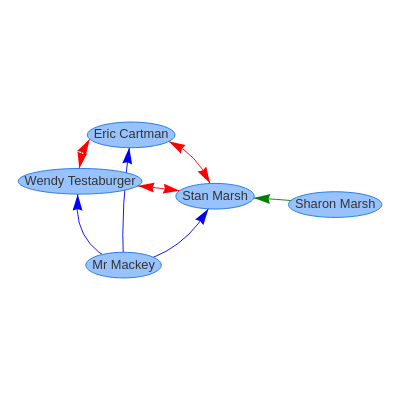
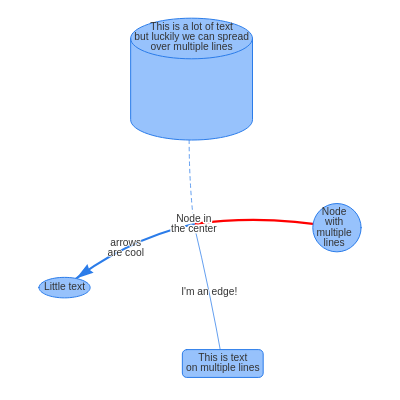
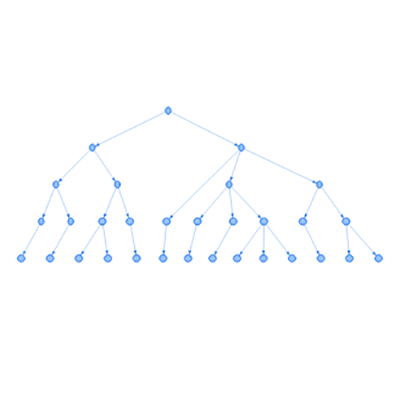
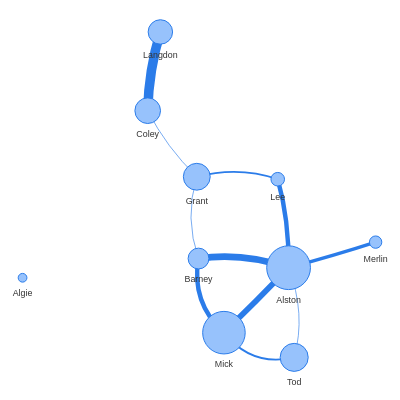
Example of network diagram
Differences between Network Diagrams, Workflow Diagrams, and Relationship Diagrams
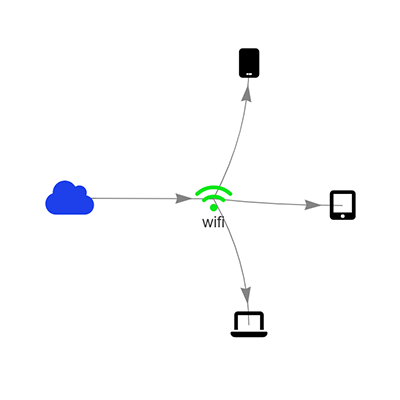
Network Diagrams: Primarily used to illustrate the connections and data flow between nodes in computer networks, communication systems, and similar setups. Nodes typically represent devices or servers, while edges represent the links between them.
Workflow Diagrams: Focus on describing the logical relationships and sequence between steps in a business process or workflow. Nodes represent different tasks or states, and edges represent the transition conditions or order between tasks.
Relationship Diagrams: Used to represent the associations between various entities or concepts, such as interpersonal relationships, organizational structures, or knowledge systems. Nodes represent entities or concepts, while edges represent the nature of their associations.
Although these three types of diagrams may appear similar in their presentation, they each have distinct focuses and applications. By selecting the appropriate diagram type based on specific requirements and scenarios, complex network structures, business processes, or relationships can be presented more clearly and effectively.
Frequently Asked Questions About Network Diagrams
What is a network diagram?
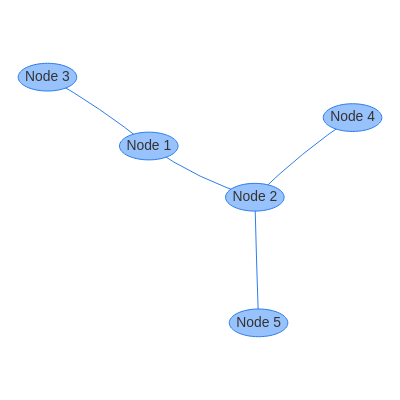
A network diagram is a visual representation of the components and connections within a network, such as devices, servers, and the links between them.
What are the benefits of using a network diagram?
Network diagrams help in understanding complex network structures, identifying potential issues, and planning for future growth. They also facilitate communication between team members and stakeholders.
How do I create a network diagram?
To create a network diagram, start by adding nodes to represent devices or servers. Then, connect the nodes with edges to illustrate the links between them. Customize the appearance of nodes and edges to convey additional information.
Can I collaborate with others on a network diagram?
Yes, you can share your network diagram with others by generating a link. This allows for easy collaboration and ensures everyone is working with the most up-to-date version of the diagram.
What are the characteristics of a network diagram?
Network diagrams are typically used to represent the connections between nodes in a network, such as devices, servers, and the links between them. They are often used in computer networks, communication systems, and similar setups.
What are the rules for drawing a network diagram?
The rules for drawing a network diagram depend on the specific requirements and context. However, some common guidelines include ensuring clarity and simplicity, using appropriate node and edge styles, and maintaining a consistent layout for better readability.
What are the limitations of network diagrams?
Network diagrams can become complex when dealing with large networks or multiple layers of connections. They may not be suitable for extremely detailed representations, but they are effective for visualizing high-level overviews and relationships.